









High school sports participation hit an all-time high of 8,266,244 students in 2024-25, according to the National Federation of State High School Associations (NFHS). Girls’ flag football grew 60% in a single year to nearly 69,000 participants, and U.S. families now spend $1,016 a year on average for one child’s primary sport — a 46% jump since 2019. This page aggregates data from NFHS, the Aspen Institute’s Project Play, the Sports & Fitness Industry Association (SFIA), CDC, Statistics Canada, and peer-reviewed psychology research into a single, source-verified reference. Readers will find current participation and spending figures, an audit of a commonly repeated but unverifiable dropout statistic, and what controlled research actually shows about award-based motivation in youth sports.
Key Takeaways
- 8,266,244 students played high school sports in 2024-25, an all-time NFHS record (NFHS).
- 65% of youth ages 6-17 tried a team sport at least once in 2024 — the highest rate SFIA has recorded since it began tracking in 2012 (Aspen Institute Project Play, citing SFIA).
- Girls’ flag football grew 60% year-over-year to 68,847 participants, with nearly 1,000 schools adding programs (NFHS).
- Boys’ regular sports participation has stayed at 42% or below for nine consecutive years, down from 50% in 2013 (Project Play/SFIA).
- The income-based participation gap widened from 13.6 to 20.2 percentage points between 2012 and 2024 (Project Play/SFIA).
- Families spent $1,016 on average on a child’s primary sport in 2024, up 46% since 2019 (Aspen Institute).
- Only 61.1% of U.S. adolescents aged 12-17 got 60 minutes of daily physical activity most days, per federal survey data from July 2021-December 2023 (CDC/NCHS).
- In Canada, the share of youth aged 12-17 meeting physical activity recommendations fell from 36% to 21% between 2018-19 and 2022-24 (Statistics Canada).
- A 128-study meta-analysis found engagement-contingent rewards produce a measurable negative effect on free-choice intrinsic motivation (d = -0.40), while positive verbal feedback increases it (Deci, Koestner & Ryan, 1999, Psychological Bulletin).
- The widely repeated claim that “70% of kids quit sports by age 13” has no traceable primary source, according to independent research by a Lasell University researcher and the Aspen Institute.
High School Sports Participation Reaches an All-Time High
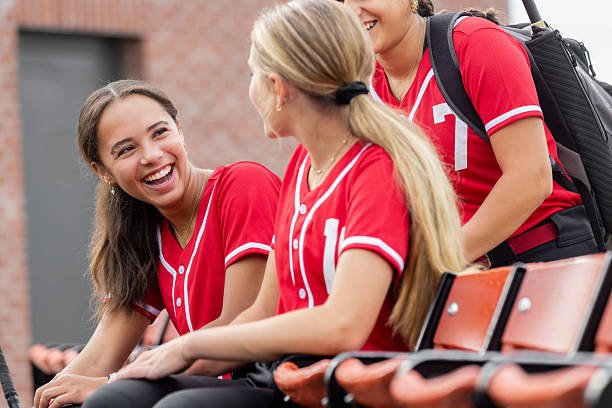
Participation has grown for three straight years since the NFHS survey resumed its full post-pandemic tracking, reversing a decline that began just before COVID-19. Growth is not evenly distributed: a small number of newer or expanding programs — girls’ flag football, girls’ wrestling, Unified Sports, and esports — account for a disproportionate share of the year-over-year gain.
8,266,244 students participated in high school sports in 2024-25 — an all-time record.
| Metric | Value | Source |
|---|---|---|
| Total participants, 2024-25 | 8,266,244 | NFHS |
| Prior record (2023-24) | 8,062,302 | NFHS |
| Boys / Girls (2024-25) | 4,726,648 / 3,539,596 | NFHS |
| Three-year post-pandemic growth | +645,000 | NFHS |
| Girls’ flag football participants (+60% YoY) | 68,847 | NFHS |
| Girls’ wrestling participants (first time over) | 74,000 | NFHS |
| Unified Sports participants (up from 51,502 in 2023-24) | 70,006 | NFHS |
Calculated statistic: NFHS reports the 2024-25 total as 8,266,244 against a prior-year figure of 8,062,302. Based on those two reported values, this represents an increase of approximately 2.5% year-over-year (203,942 ÷ 8,062,302) — a figure we calculated from NFHS’s own numbers rather than one NFHS stated directly.
Discrepancy note: NFHS’s own site reports 8,266,244 total participants for 2024-25. Several syndicated news outlets covering the same release (Coastal Point, Sports Illustrated, Youth Sports Business Report) instead reported 8,260,891, paired with a slightly different gender breakdown (4,723,907 boys / 3,536,984 girls) and a smaller year-over-year gain (+198,589). Both figures are internally consistent with their own paired numbers, which rules out a simple typo — the most likely explanation is a preliminary tally reported by wire coverage versus a later-finalized number on NFHS’s own site. This piece uses NFHS’s self-published figure as the primary-source number, since NFHS is the data owner.
NFHS CEO Dr. Karissa Niehoff has stated that the large majority of student-athletes are primarily there to compete and have fun with teammates rather than chase headlines about transfers or NIL — a relevant framing note for anyone reading the participation numbers, though it’s her characterization rather than a disclosed survey result, so it isn’t included in the table above.
Source: nfhs.org
Youth Participation: Casual Growth, Regular Decline, and How the U.S. Compares
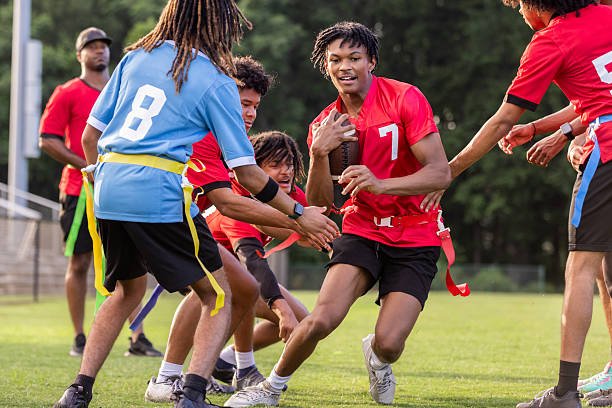
Below the high school level, more kids are trying sports than ever, but fewer are playing them regularly enough to stay in an organization’s long-term recognition pipeline. U.S. federal health data and Canadian national data both show declining regular physical activity among teenagers specifically — suggesting the U.S. teen participation dip isn’t an isolated phenomenon.
65% of youth ages 6-17 tried a team sport at least once in 2024 — the highest rate on record since SFIA began tracking in 2012.
| Metric | Value | Source |
|---|---|---|
| Youth 6-17 who tried a sport at least once, 2024 (vs. 59% in 2021) | 65% | Aspen Institute Project Play (SFIA data) |
| Core (regular) participation, ages 6-12 | 3rd consecutive annual increase, highest since 2015 | Project Play (SFIA) |
| Core participation, teens 13-17, 2024 | -3% YoY | Project Play (SFIA) |
| Boys’ regular participation, 9 consecutive years | ≤42% (down from 50% in 2013) | Project Play (SFIA) |
| Children 6-17 who played organized sports, 2022-23 | 27.3 million (54.6%) | National Survey of Children’s Health (federal) |
| U.S. adolescents 12-17 meeting 60-min/day activity guideline, Jul 2021-Dec 2023 | 61.1% | CDC/NCHS |
| Canadian youth 12-17 meeting activity recommendations, 2022-24 (vs. 36% in 2018-19) | 21% | Statistics Canada |
Context: The National Survey of Children’s Health trend line adds useful texture: organized sports participation among U.S. 6-17-year-olds was 56.1% in 2019, fell to a pandemic-era low of 48.5% in 2021, and recovered to 54.6% by 2022-23 — still below pre-pandemic levels even as SFIA’s “tried at least once” figure hit a record high. The two data sources measure different things (any casual trial vs. sustained organized participation), which is likely why they appear to tell slightly different recovery stories; this is a definitional difference, not a contradiction.
The Statistics Canada figures line up directionally with the U.S. teen decline: Canadian male youth activity fell from 50% to 33% meeting guidelines between the two survey periods, and female youth fell from 21% to 8% — a steeper drop than seen in available U.S. teen data, though the two countries measure activity with different instruments and can’t be compared as a single combined statistic.
Sources: projectplay.org, cdc.gov/nchs, statcan.gc.ca
The Cost of Youth Sports and the Awards/Recognition Economy
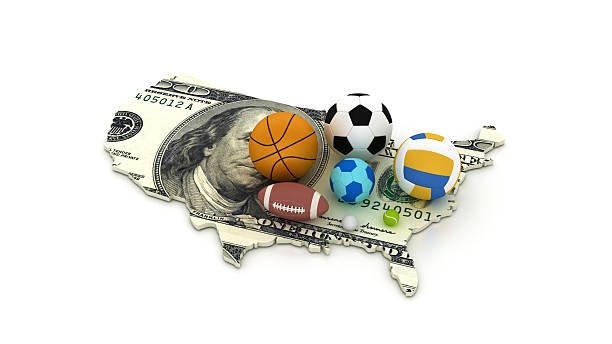
Awards and recognition items sit downstream of a much larger youth-sports spending pattern. As families spend more to keep kids in organized sports, the market for recognizing that participation — trophies, plaques, medals, engraved awards — has grown alongside it, though it is measured far less rigorously than participation itself. Organizations sourcing these awards directly — whether custom medals for competition winners or custom pins for broader participant recognition — sit within this broader engraving market rather than being tracked as a separate category in most industry data.
The average U.S. family spent $1,016 on a child’s primary sport in 2024 — a 46% increase since 2019.
| Metric | Value | Source |
|---|---|---|
| Average family spend, child’s primary sport, 2024 | $1,016 (+46% since 2019) | Aspen Institute Project Play |
| Average family spend, all of a child’s sports activities, 2024 | ~$1,500 | Aspen Institute Project Play |
| Estimated total annual U.S. family spending on kids’ sports | $40 billion+ | Aspen Institute (own estimate) |
| Baseball average annual cost, 2019 → 2024 | $660 → $1,113 | Aspen Institute Project Play |
| Soccer average annual cost, 2019 → 2024 | $537 → $910 | Aspen Institute Project Play |
| Basketball average annual cost, 2019 → 2024 | $427 → $876 | Aspen Institute Project Play |
| U.S. engraving services industry size, 2025 (plaques, trophies, and other engraved goods) | $2.0 billion | IBISWorld |
Calculated statistic: IBISWorld reports the engraving services industry grew at a 5.2% five-year CAGR to reach $2.0 billion in 2025. Working backward from that reported growth rate implies a 2020 market size of approximately $1.55 billion — a figure we calculated, not one IBISWorld stated directly.
Caveat on the market-size figure: IBISWorld’s $2.0 billion figure covers the broader engraving category — plaques, trophies, invitations, firearms, electronics, and industrial ID tags — not trophies and sports awards alone. Multiple market-research firms publish “metal trophies market” figures specific to awards, but they range from roughly $1.8 billion to $6.1 billion for what is nominally the same global market, with no shared methodology disclosed. Given that inconsistency, this piece does not present any trophy-specific market-size figure as settled fact.
Sources: projectplay.org, ibisworld.com
Equity Gaps in Youth Sports Access
Rising costs compound an access gap that predates the current cost spike. Recognition programs only reach kids who can afford to participate in the first place.
The income-based participation gap nearly doubled from 13.6 to 20.2 percentage points between 2012 and 2024.
| Metric | Value | Source |
|---|---|---|
| Income participation gap (highest- vs. lowest-income households), 2012 → 2024 | 13.6 pts → 20.2 pts | Project Play (SFIA) |
| Likelihood of travel-sport participation, $100k+ household vs. <$50k household | ~2x more likely | Aspen Institute parent survey |
| States that have reached the federal 63%-by-2030 youth participation target | 14 states | Project Play |
| Lowest-income teens (13-17) participation, 2012 → 2022 (most recent available data for this cut) | 38% → 27% | Project Play, State of Play 2023 |
Source: projectplay.org
The “70% Quit by Age 13” Myth vs. What Attrition Data Shows
This is one of the most frequently repeated statistics in youth-sports writing, and it does not hold up to source-tracing.
No verifiable primary source exists for the claim that “70% of kids quit organized sports by age 13.”
| Finding | Status | Source |
|---|---|---|
| “70% of kids quit sports by 13” | Unverifiable — no traceable primary study | Joseph Janosky (Lasell University), Marty Fox (Aspen Institute) |
| Individual-sport churn rate (year-over-year attrition within a specific sport) | Often 40-50% (most recent available data: State of Play 2023, not 2025) | Project Play (SFIA) |
Researcher Joseph Janosky and Aspen Institute youth-sports consumer advocate Marty Fox each independently traced the “70% by 13” figure back nearly four decades and found only a chain of secondary sources citing one another — a pattern researchers call citation drift, where a number is repeated and normalized without ever being anchored to verifiable original data. Fox’s reframing is more defensible: it isn’t that most kids quit sports by 13, but that kids quit specific sports by 13, often shifting to a different sport, a lower-intensity version of the same sport, or informal play. The measurable, sourced phenomenon is sport-specific churn — which is real and well-documented, just distinct from the viral statistic.
Source: projectplay.org
The Participation Trophy Debate: What Controlled Research Actually Shows

Unlike most claims in the participation-trophy debate, the underlying question — do external rewards affect intrinsic motivation? — has been studied directly and repeatedly in controlled psychology research, independent of youth sports specifically. That research is more useful than the many unsourced “statistics” that circulate about trophies themselves.
A 128-study meta-analysis found that engagement-contingent rewards produced a significant negative effect on free-choice intrinsic motivation (d = -0.40).
| Finding | Effect size / result | Source |
|---|---|---|
| Engagement-contingent rewards (given just for participating) vs. free-choice intrinsic motivation | d = -0.40 | Deci, Koestner & Ryan (1999), Psychological Bulletin |
| Completion-contingent rewards vs. free-choice intrinsic motivation | d = -0.36 | Deci, Koestner & Ryan (1999) |
| Performance-contingent rewards vs. free-choice intrinsic motivation | d = -0.28 | Deci, Koestner & Ryan (1999) |
| Positive verbal feedback (praise, not tangible reward) | Increased both free-choice behavior and self-reported interest | Deci, Koestner & Ryan (1999) |
| Contrasting 1994 meta-analysis (pre-dating and disputed by the above) | Found reward effects “limited and easily prevented” | Cameron & Pierce (1994) |
Context and contradiction: These two meta-analyses disagree, and it matters why. Cameron and Pierce’s 1994 analysis concluded that negative effects of rewards on motivation were limited; Deci, Koestner, and Ryan’s 1999 re-analysis — examining a larger and more recent set of 128 studies — found “pervasive negative effects” instead, and subsequent researchers have generally treated the 1999 analysis as the more methodologically rigorous of the two. Neither study was conducted specifically on youth sports trophies; both concern tangible extrinsic rewards for structured tasks more broadly, including classroom settings. Applying these findings to youth sports participation trophies specifically is a reasonable extrapolation, not a direct measurement, and readers should treat it that way — a distinction most “participation trophy statistics” pages do not make.
Source: leeds-faculty.colorado.edu (Deci et al. 1999, PDF)
Youth & School Sports Awards, by the Numbers
| Metric | Value | Source |
|---|---|---|
| Total HS sports participants, 2024-25 | 8,266,244 | NFHS |
| Prior participation record, 2023-24 | 8,062,302 | NFHS |
| Girls’ flag football growth, YoY | +60% (68,847) | NFHS |
| Girls’ wrestling participants | 74,000+ | NFHS |
| Unified Sports participants, 2024-25 | 70,006 | NFHS |
| Youth 6-17 who tried a sport at least once, 2024 | 65% | Project Play (SFIA) |
| Boys’ regular participation, 9-year streak | ≤42% | Project Play (SFIA) |
| Income participation gap, 2012 → 2024 | 13.6 → 20.2 pts | Project Play (SFIA) |
| U.S. children 6-17 in organized sports, 2022-23 | 27.3M (54.6%) | National Survey of Children’s Health |
| U.S. adolescents meeting daily activity guideline | 61.1% | CDC/NCHS |
| Canadian youth meeting activity guideline, 2022-24 (vs. 36% in 2018-19) | 21% | Statistics Canada |
| Avg. family spend, child’s primary sport, 2024 | $1,016 (+46% since 2019) | Aspen Institute |
| Avg. family spend, all sports activities | ~$1,500 | Aspen Institute |
| Estimated total U.S. family spending on kids’ sports | $40B+ | Aspen Institute (estimate) |
| U.S. engraving services industry size, 2025 | $2.0B | IBISWorld |
| “70% quit by 13” claim | Unverifiable | Janosky (Lasell)/Fox (Aspen) |
| Sport-specific attrition (churn), most recent data | 40-50% | Project Play, 2023 |
| Engagement-contingent rewards vs. intrinsic motivation | d = -0.40 | Deci, Koestner & Ryan (1999) |
| Positive verbal feedback vs. intrinsic motivation | Increased motivation | Deci, Koestner & Ryan (1999) |
| 14 states have reached | 63% participation target | Project Play |
Sources
- National Federation of State High School Associations (NFHS) — 2024-25 High School Athletics Participation Survey. nfhs.org
- Aspen Institute Project Play — State of Play 2025 (and 2023, where noted); National Youth Sports Parent Survey with Utah State University and Louisiana Tech University (n=1,848 parents, Nov-Dec 2024). projectplay.org
- Sports & Fitness Industry Association (SFIA) — underlying household participation data used throughout Project Play’s reporting.
- National Survey of Children’s Health — federal survey of organized sports participation among 6-17-year-olds.
- CDC/National Center for Health Statistics — QuickStats, adolescent physical activity, July 2021-December 2023. cdc.gov/nchs
- Statistics Canada — Canadian Health Measures Survey, 2022-2024. statcan.gc.ca
- IBISWorld — U.S. Engraving Services industry market-size report. ibisworld.com
- Deci, E. L., Koestner, R., & Ryan, R. M. (1999). “A meta-analytic review of experiments examining the effects of extrinsic rewards on intrinsic motivation.” Psychological Bulletin, 125(6), 627-668.
- Cameron, J., & Pierce, W. D. (1994). Meta-analysis on reward and intrinsic motivation, as characterized and re-examined in Deci et al. (1999).
- Janosky, J. (Lasell University) and Fox, M. (Aspen Institute Sports & Society program) — citation-tracing investigation of the “70% dropout by 13” claim, as reported by Tucson.com.
No statistic on this page was included to reach a target count, and no statistic with unclear or unverifiable sourcing was included. Two internal discrepancies (the dual NFHS participation totals; two data points sourced from an older 2023 report rather than the current 2025 one) are disclosed directly in the sections above rather than silently resolved.